CASE STUDY
Redesigned internal data pipeline: reduced processing time by 67%
AIIMDB is an internal tool that utilizes Directus to hold all data for the USC Annenberg Inclusion Initiative.
TIMELINE
Oct 2024 - Jul 2025
ROLE
Product Manager, UX Designer
CLIENTS
USC Annenberg Inclusion Initiative
LOCATION
Los Angeles
Project Overview
As part of the Annenberg Inclusion Initiative, the leading think tank studying diversity in entertainment, I led a redesign of our data collection workflow for capturing gender and race/ethnicity of individuals working in film and television. Our original process heavily relied on Google Sheets and Google Docs which created data inconsistencies and bottlenecks across teams.
Drawing from direct management of researchers and coordination with our data management team, I applied user-centered design thinking to implement a more efficient and centralized system using our headless CMS (Directus).
My Role
As the User Experience Designer, I identified pain points, designed the new system workflow, led the rollout, and hired and trained researchers.
This case study exemplifies how I utilized user-centered design to optimize internal workflows, empower teams, and improve data fidelity in high-impact research environments.
Problems
While our previous process using Google Sheets and Google Docs collected nearly 40,000 records, it was hindered by critical workflow issues:
WORKFLOW DELAYS AND WAIT TIME FOR RESEARCHERS
Lack of research assistant autonomy led to wait times and inconsistent assignments
QUALITY CONTROL ISSUES IN INTERNAL DATABASE
Disconnected evidence documentation stored in Google Docs and not in internal database
HEAVY RELIANCE ON DATA MANAGEMENT TEAM
Dependence on data team to scrape and upload Internet Movie Database (IMDb) data in chunks
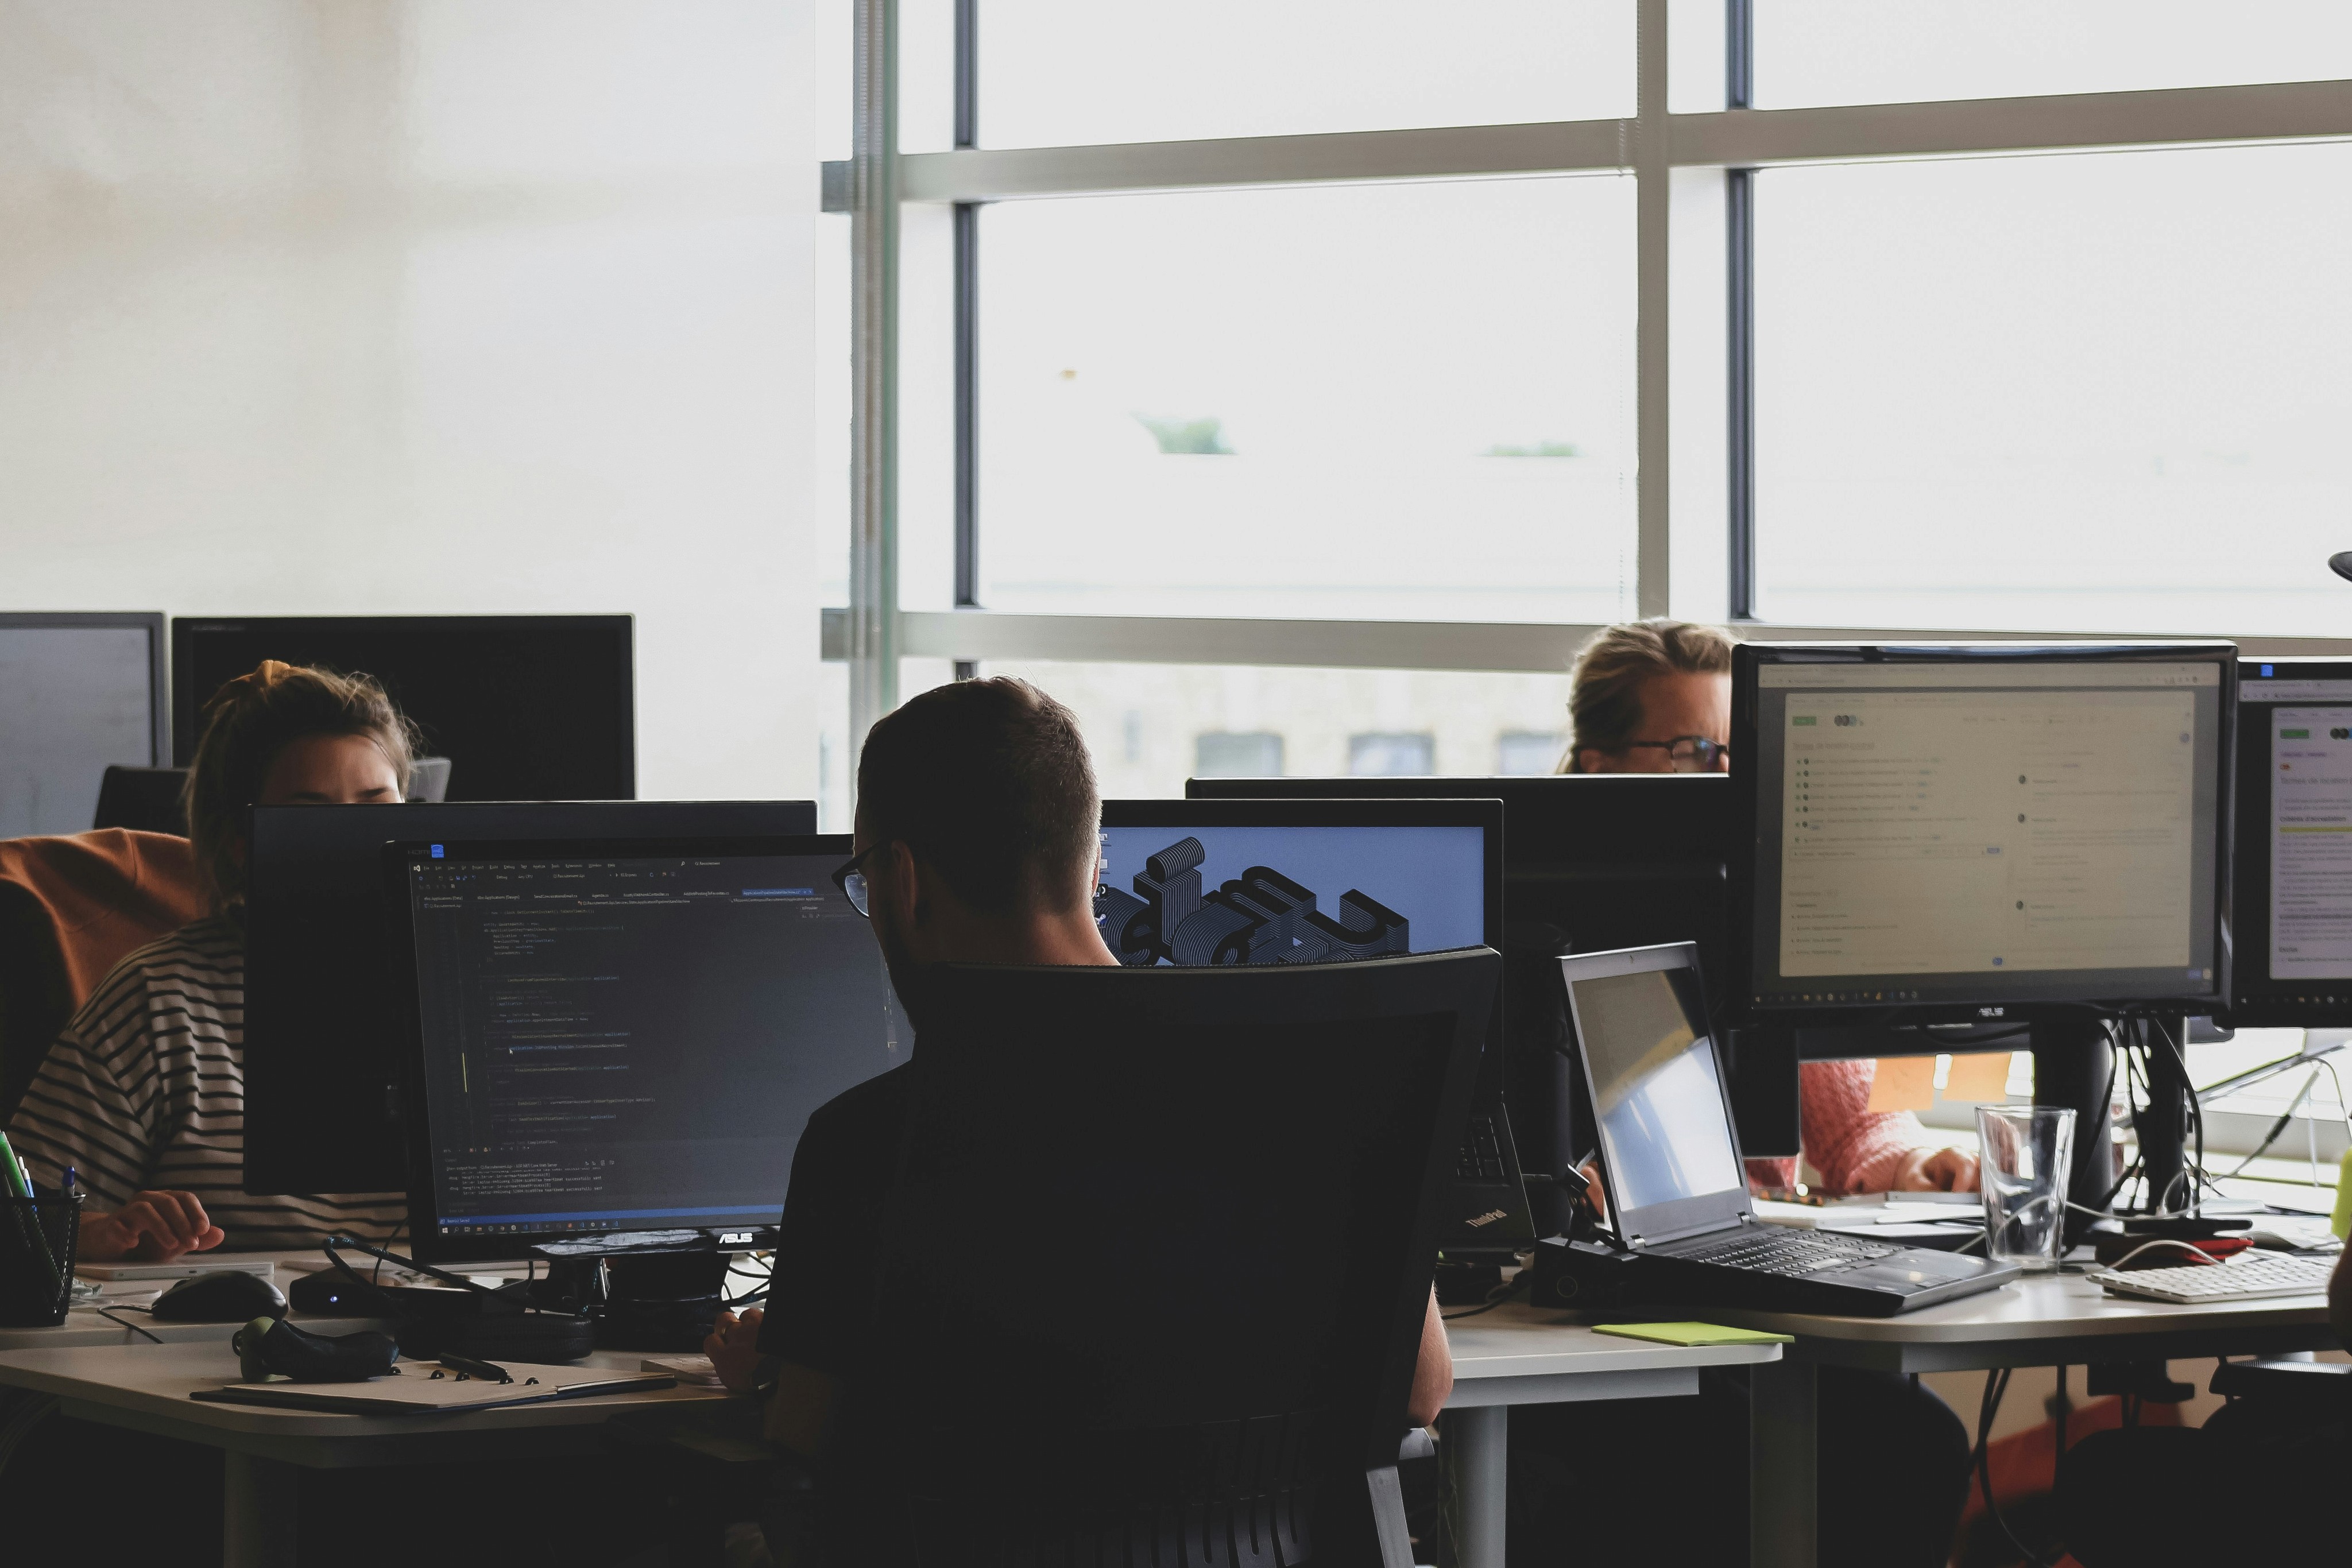
Field User Research
Over six semesters, I supervised a rotating team of 10 to 24 research assistants per term during a 2 year data collection effort on Oscar nominees and film/TV crew. I gathered user data through daily check-ins, troubleshooting, and in-depth interviews.

Identifying Pain Points
Researcher Issues
Researchers were confused by column headers and duplicate versions of Sheets
Evidence links were often misplaced, undocumented, or non accessible
Several people working on a Google Sheet at once decreased the load time significantly which led to accidental crossover and deletion in work
Research assistants had no context of the entire process which led to frequent mistakes
Internal Team Issues
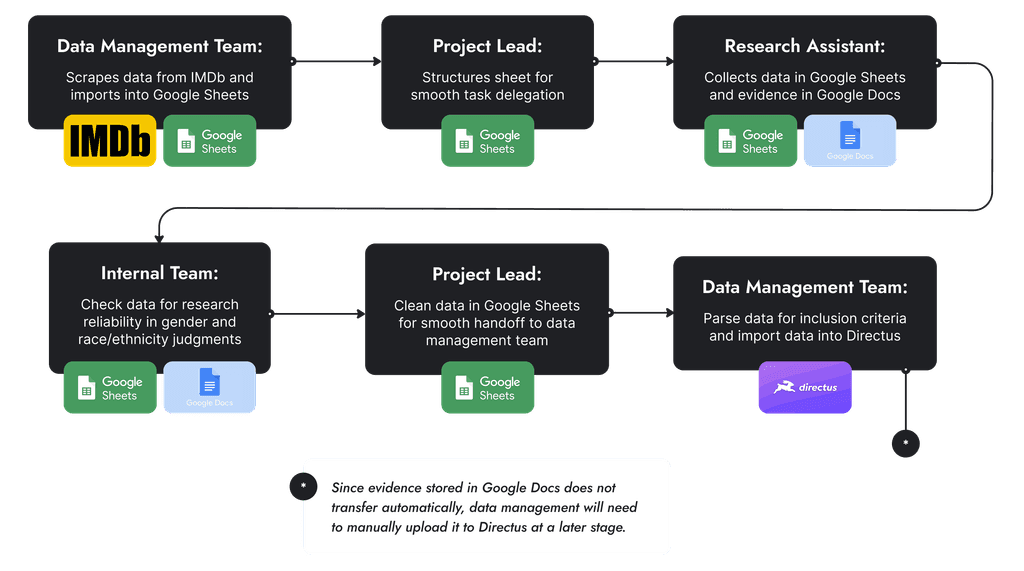
Data management team spent significant time exporting IMDb scraped data and manually inputting into Google Sheets
Project lead was responsible for maintaining sheet structure and usability
Project lead had to track down former students for access and fix broken evidence links
Data management team parsed data for inclusion criteria and manually uploaded data to Directus which was costly in time
Design Goals
Based on research and feedback, I determined the following user and system goals:
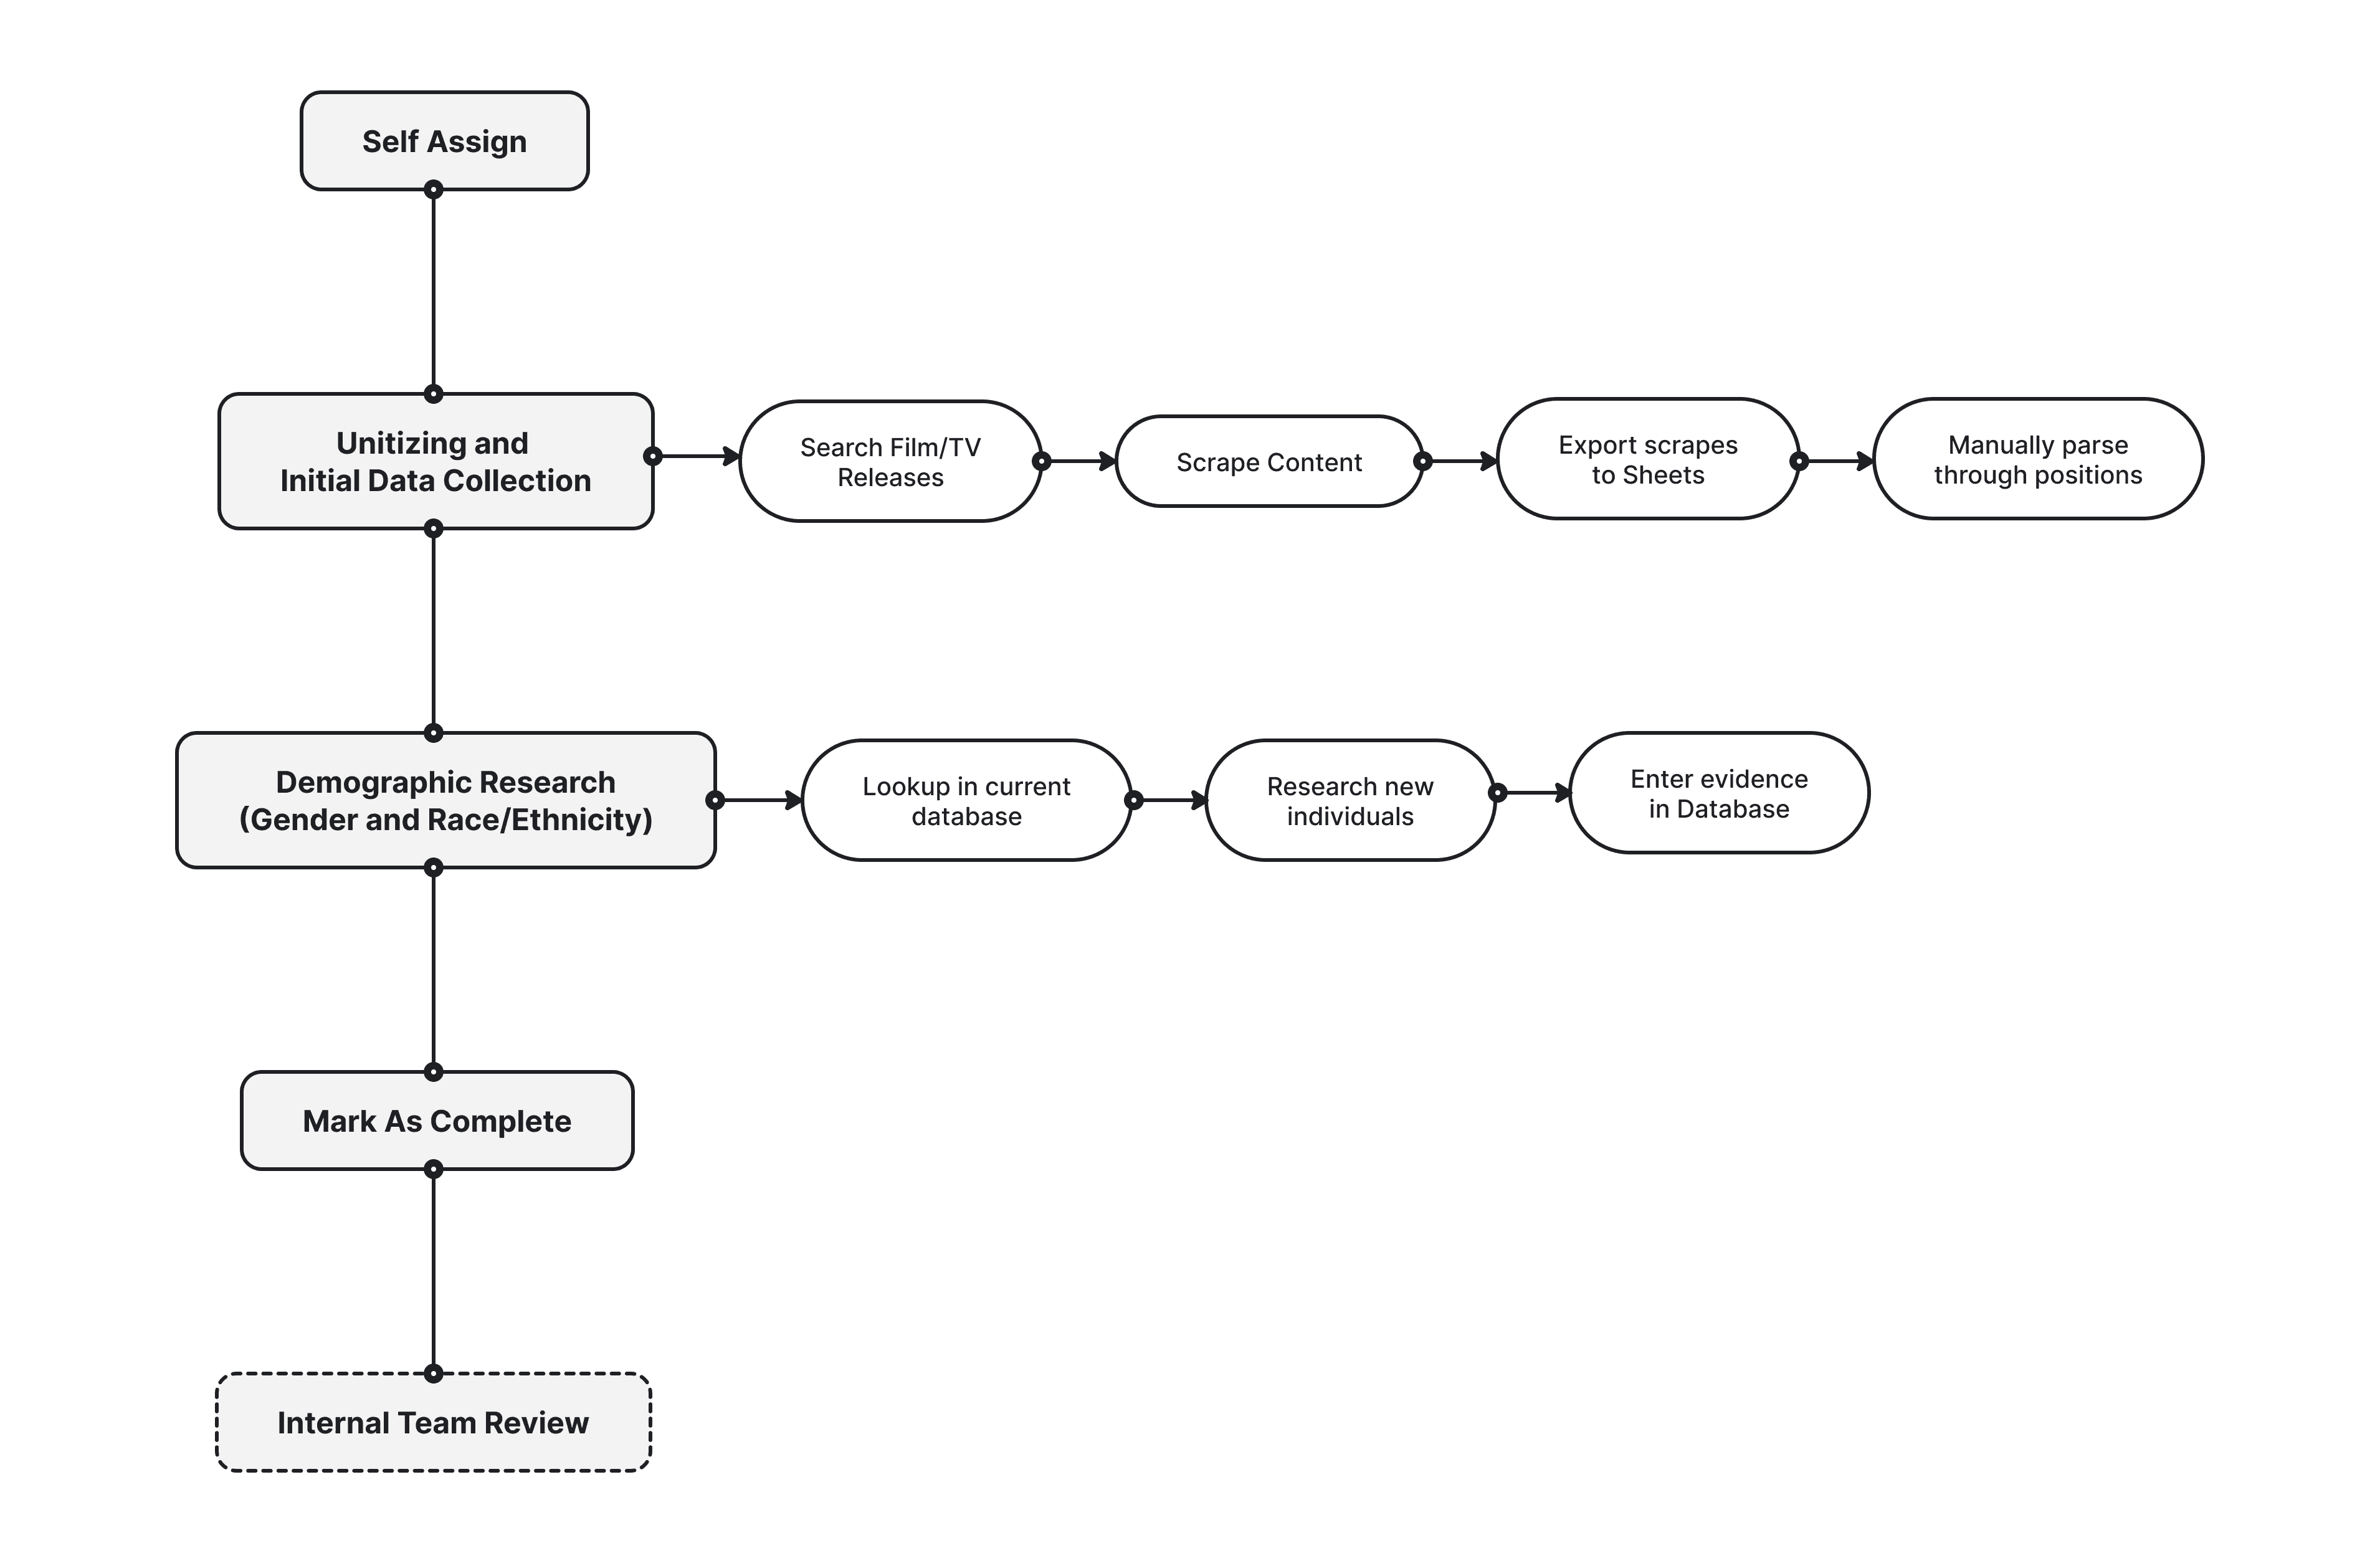
Brainstorm Sketching a User Flow
I brainstormed a user flow, including steps for a new process that would accomplish design goals.
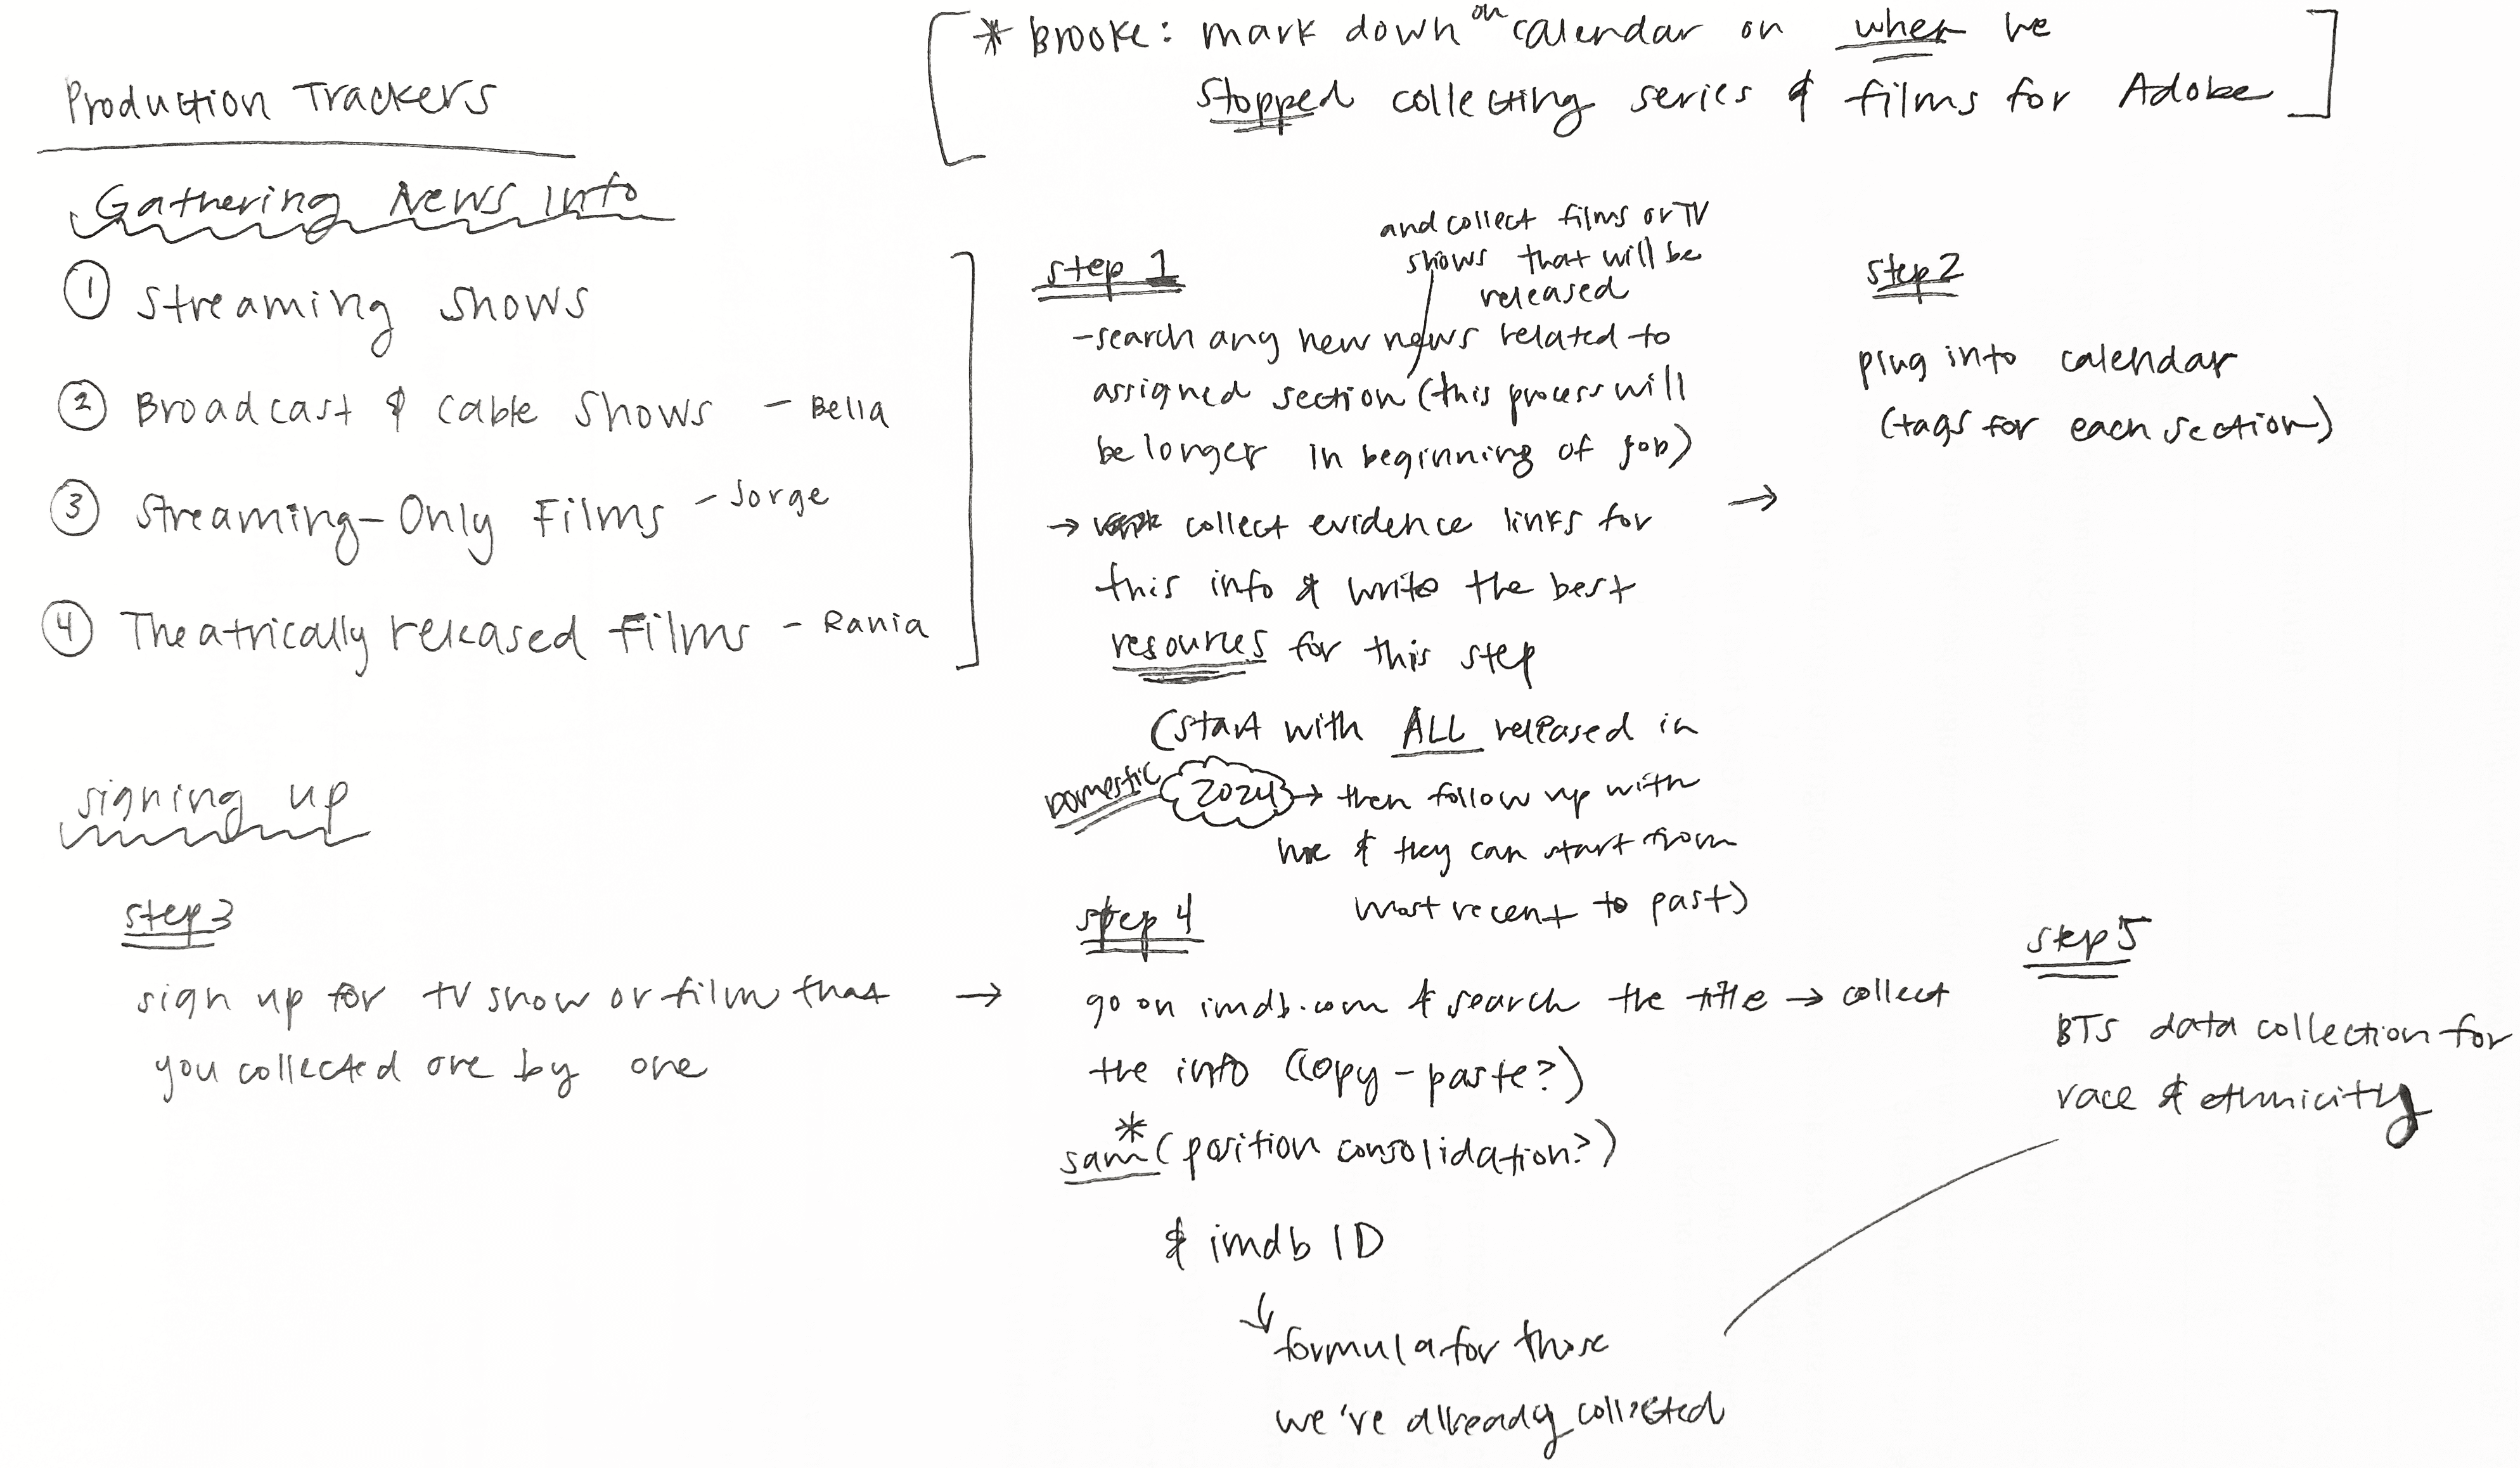
To Address Challenges, I Conceptualized a New Process
I created an organized flow diagram to visualize a new process that would give more autonomy to researchers and remove the need for time consuming internal team intervention.
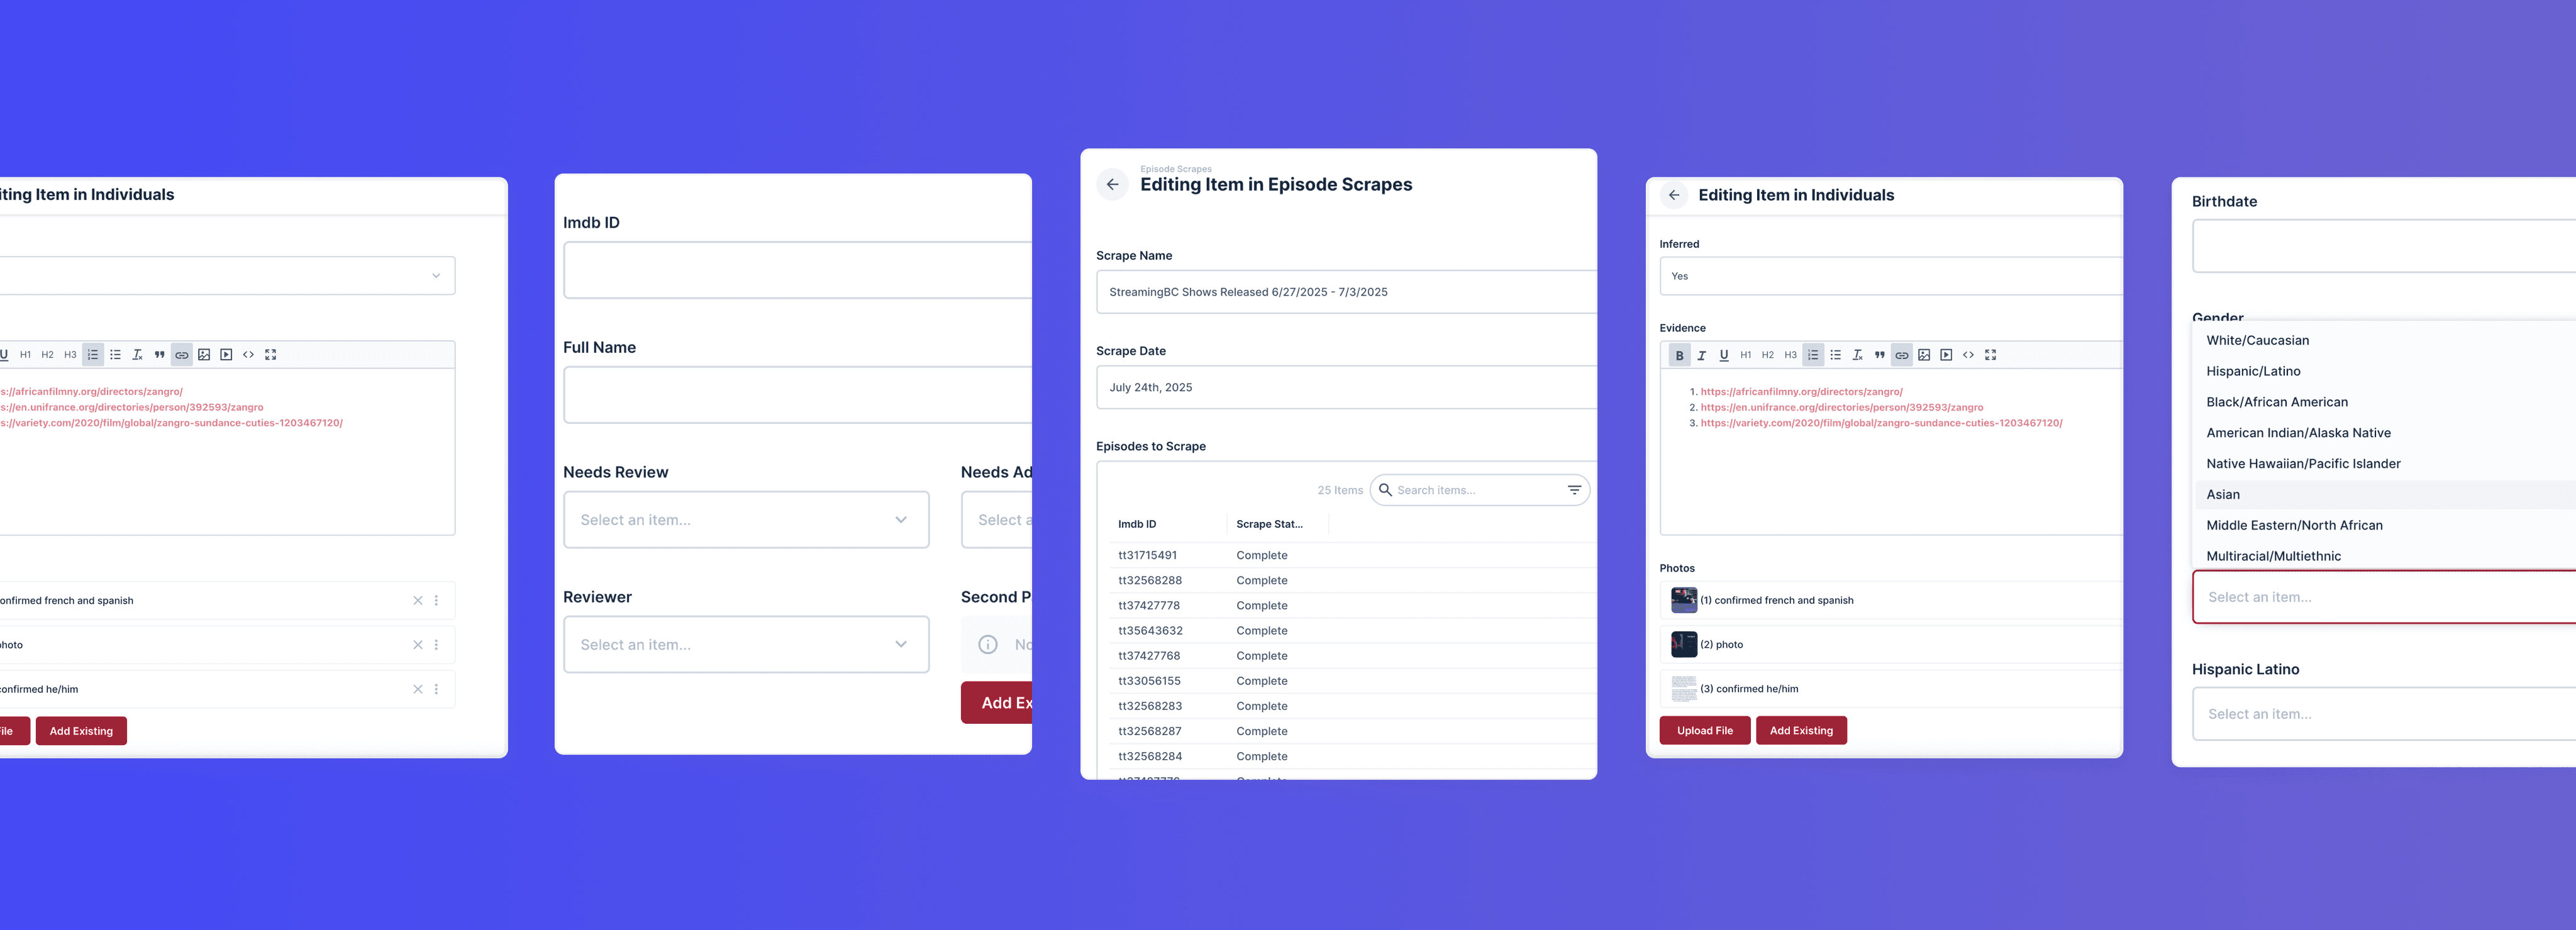
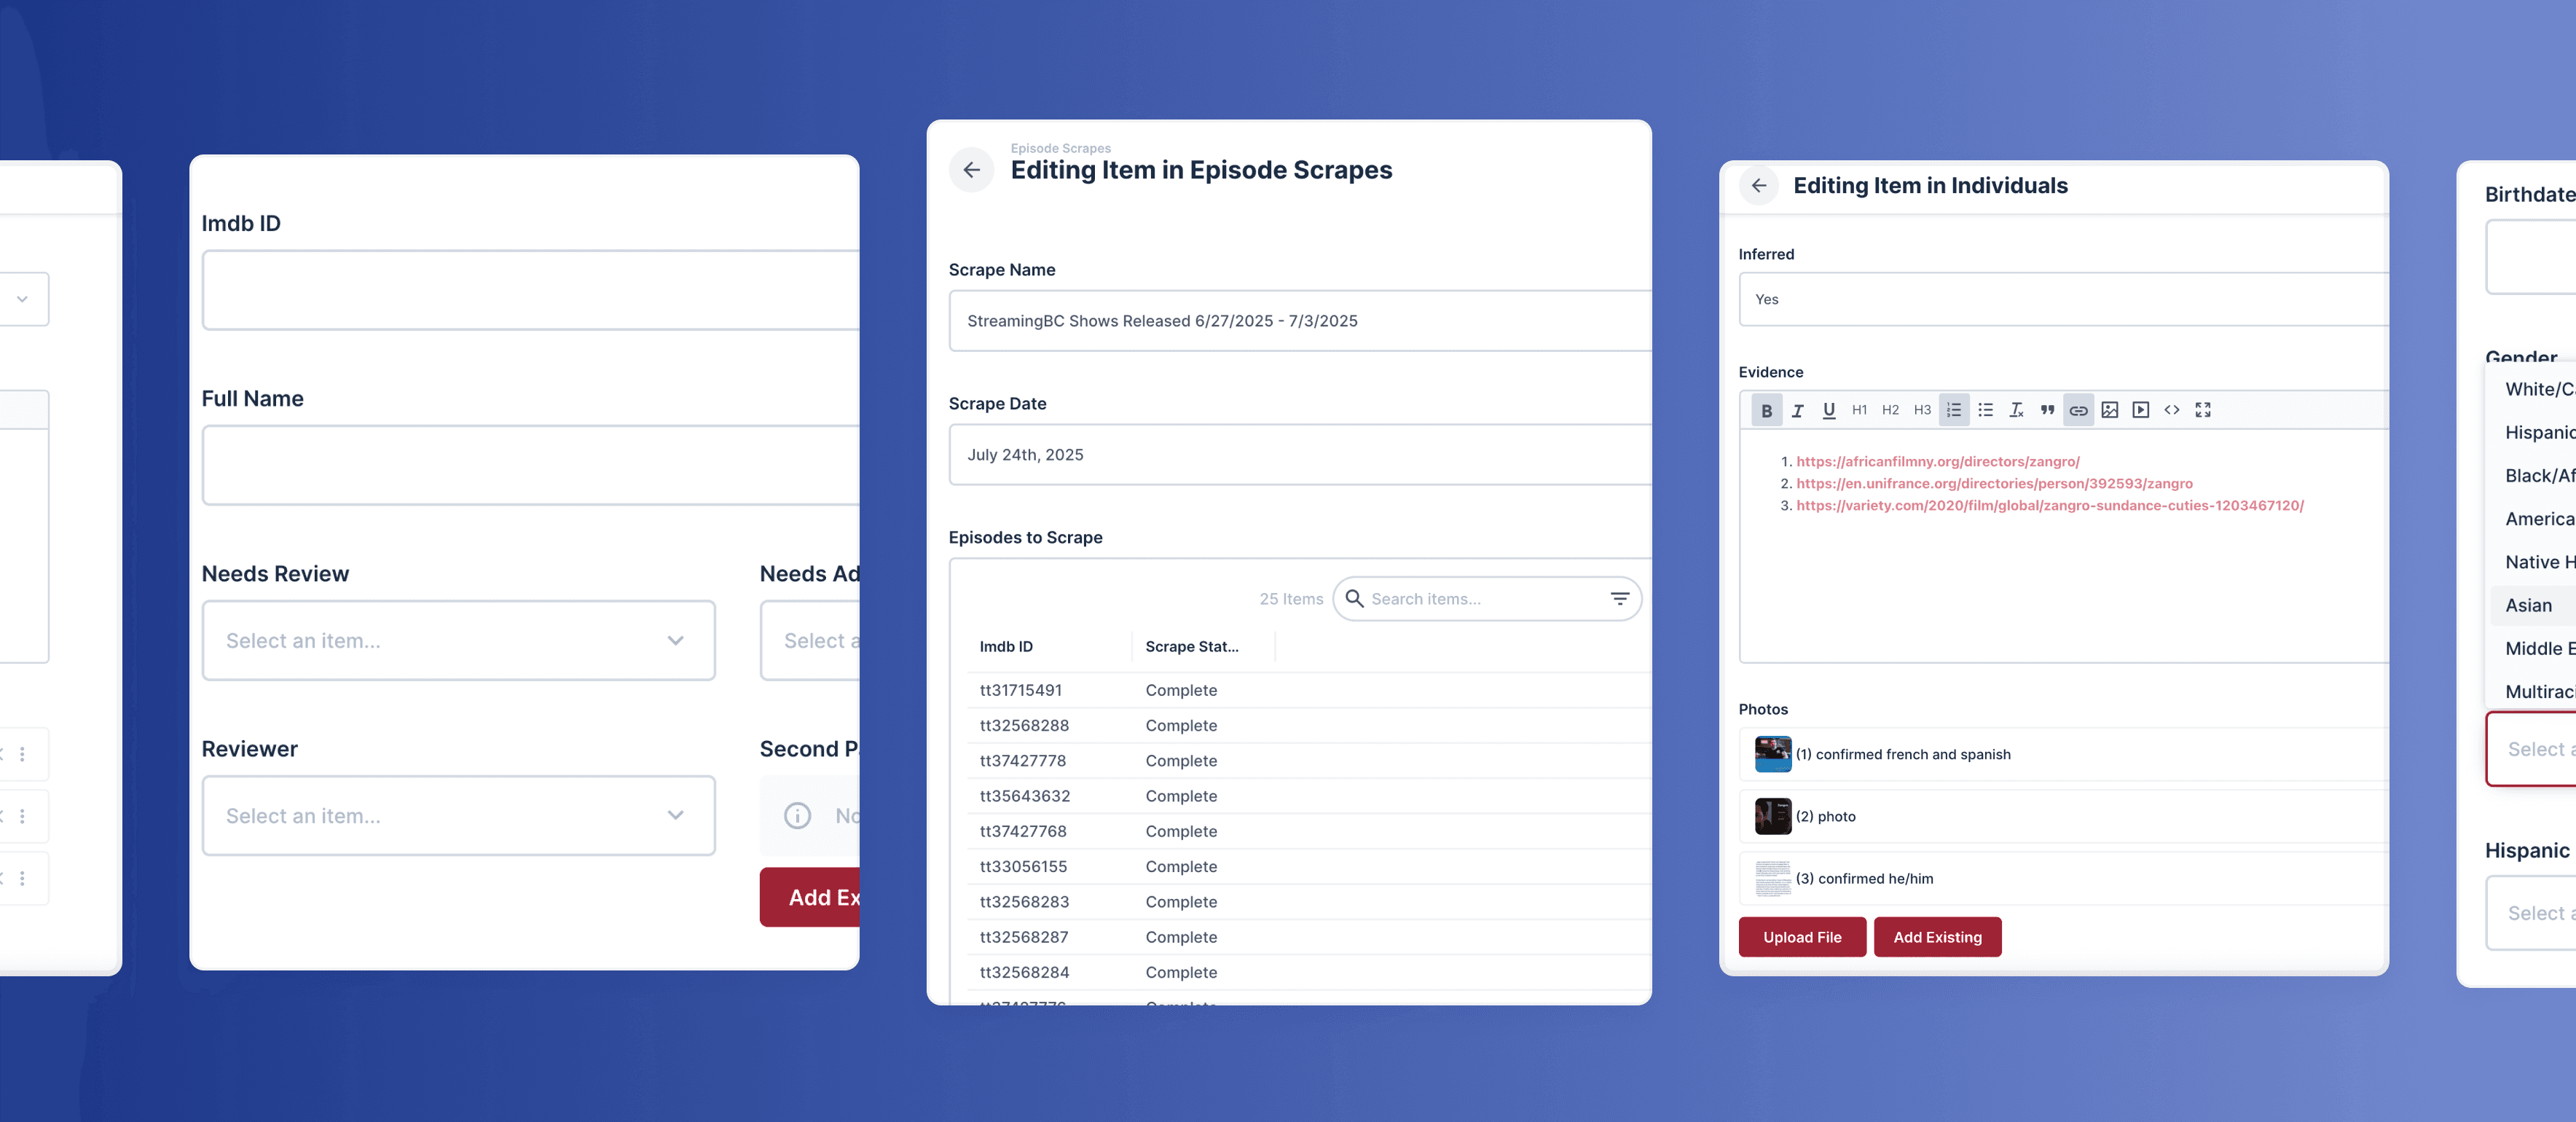
I Implemented a New Model:
The Production Tracking Team
I built specialized team of researchers who could independently manage the entire data collection pipeline. These researchers were responsible for data scraping, filtering and entering in Directus with complete demographic information and evidence.
To support this new workflow, I wrote a comprehensive SOP and worked with our developer to introduce several UX improvements. Production Trackers were provided their own account to create, edit, and track their entries and evidence directly in the database. This approach gave students full ownership over the process from start to finish, eliminating the need for middlemen and increasing efficiency and accountability.
The Previous Process Had Too Many Handoffs Which Led to Bottlenecks
My New System Eliminated Bottlenecks and Gave Autonomy to Researchers
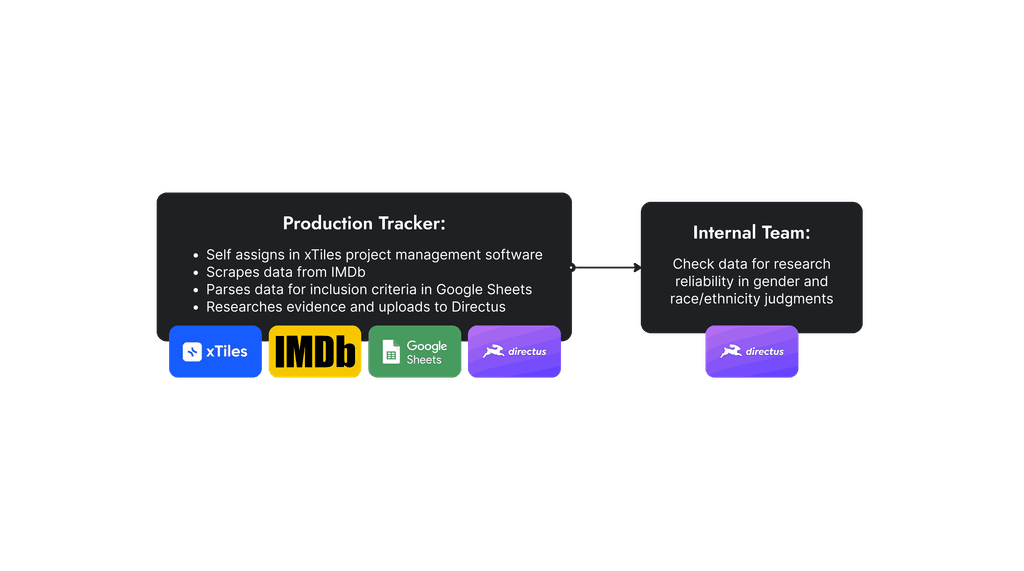
I created and trained a specialized group of students who could independently manage the entire data collection pipeline.
The Production Tracking Team now operates smoothly and collects inclusion data on theatrical films, streaming films and series, and broadcast and cable series.

Impact
REDUCED PROCESSING TIME BY 67%
Reduced average processing time per entry from 54 minutes to 18 minutes—a 3x improvement in speed and a 67% reduction in turnaround time.
SAVED $77K ANNUALLY
Saved $77K annually by streamlining production tracking workflows, reducing researcher staffing needs by 82% (from an average of 11 to 2).
YEAR-ROUND COVERAGE
Shifted from ad-hoc quarterly audits to continuous year-round monitoring, expanding coverage from 25% to 100% of new film and series releases.